Real-Time Monitoring for Cocoon Shed & Mulberry Farm
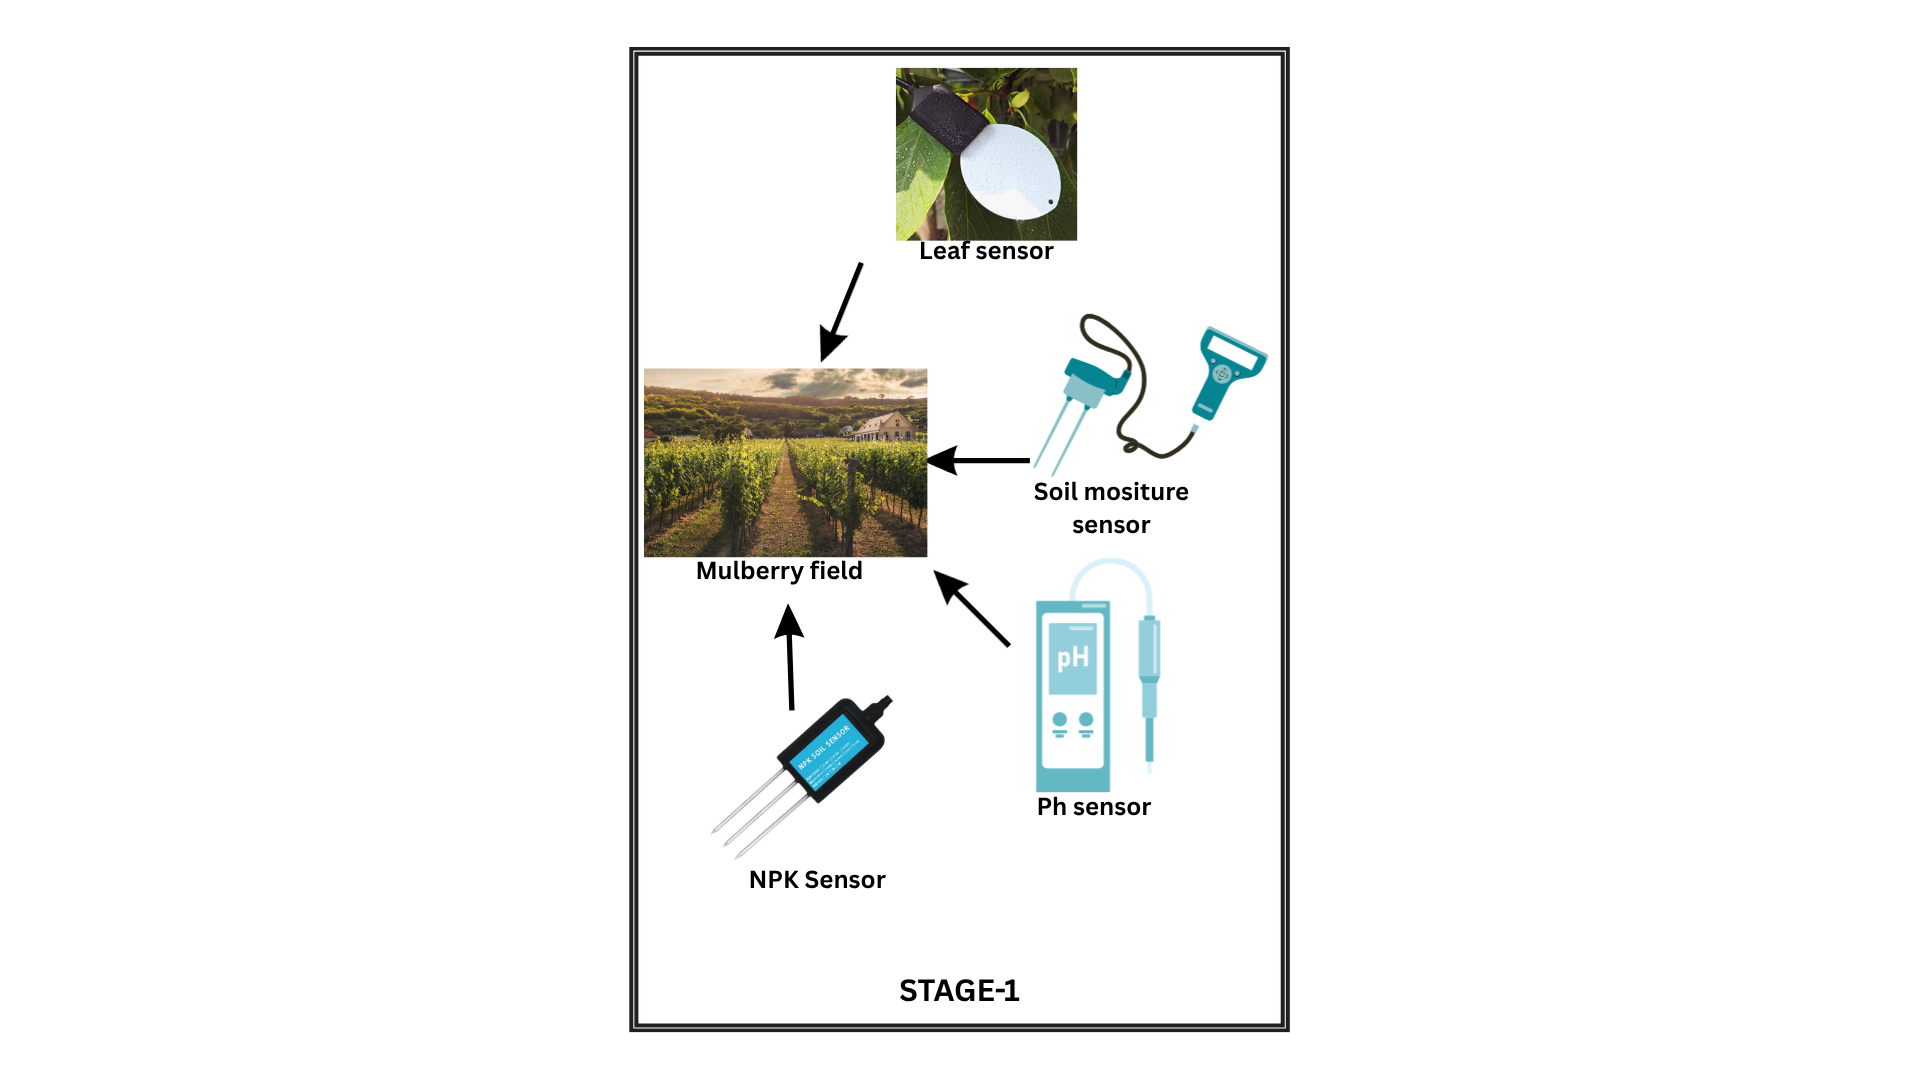
Stage 1 of the silk farming environment monitoring system focuses on data collection from the mulberry field, where the quality of the leaves directly determines the quality of silk produced.
To achieve optimal conditions for mulberry growth, a network of sensors is deployed to monitor critical environmental parameters in real time.
These sensors work together to provide continuous monitoring of the mulberry field environment, enabling data-driven decisions regarding irrigation, soil health, and leaf quality improvement. The goal of Stage 1 is to ensure a steady and healthy leaf yield — the foundation for successful cocoon rearing.
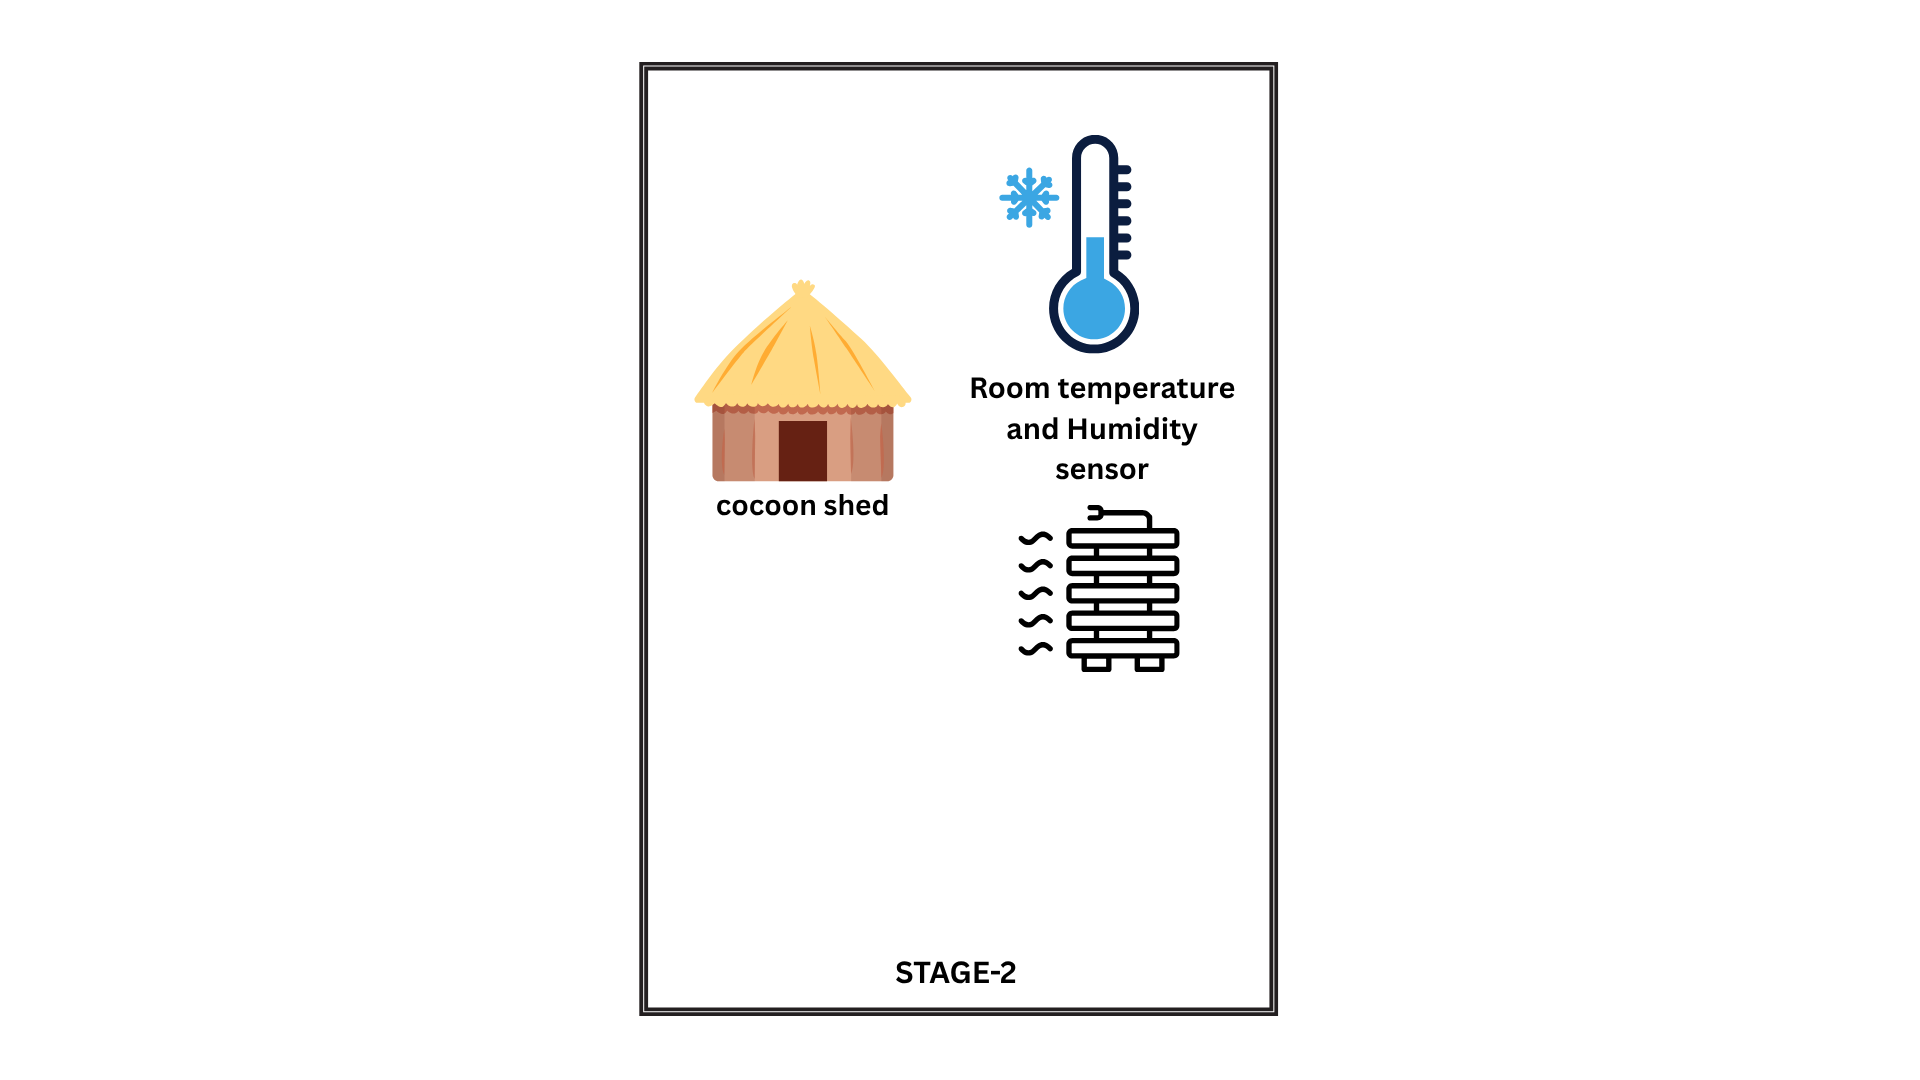
Once the mulberry leaves are harvested, the focus shifts to silkworm rearing, which takes place in a controlled cocoon shed. Stage 2 ensures that environmental parameters within the rearing shed are continuously monitored and maintained to provide an ideal habitat for silkworm development.
Stage 2 ensures the silkworms are raised in a stable, controlled, and data-monitored environment. Proper environmental management leads to better cocoon quality, reduced mortality, and consistent silk yield — making this stage vital for the silk production cycle.
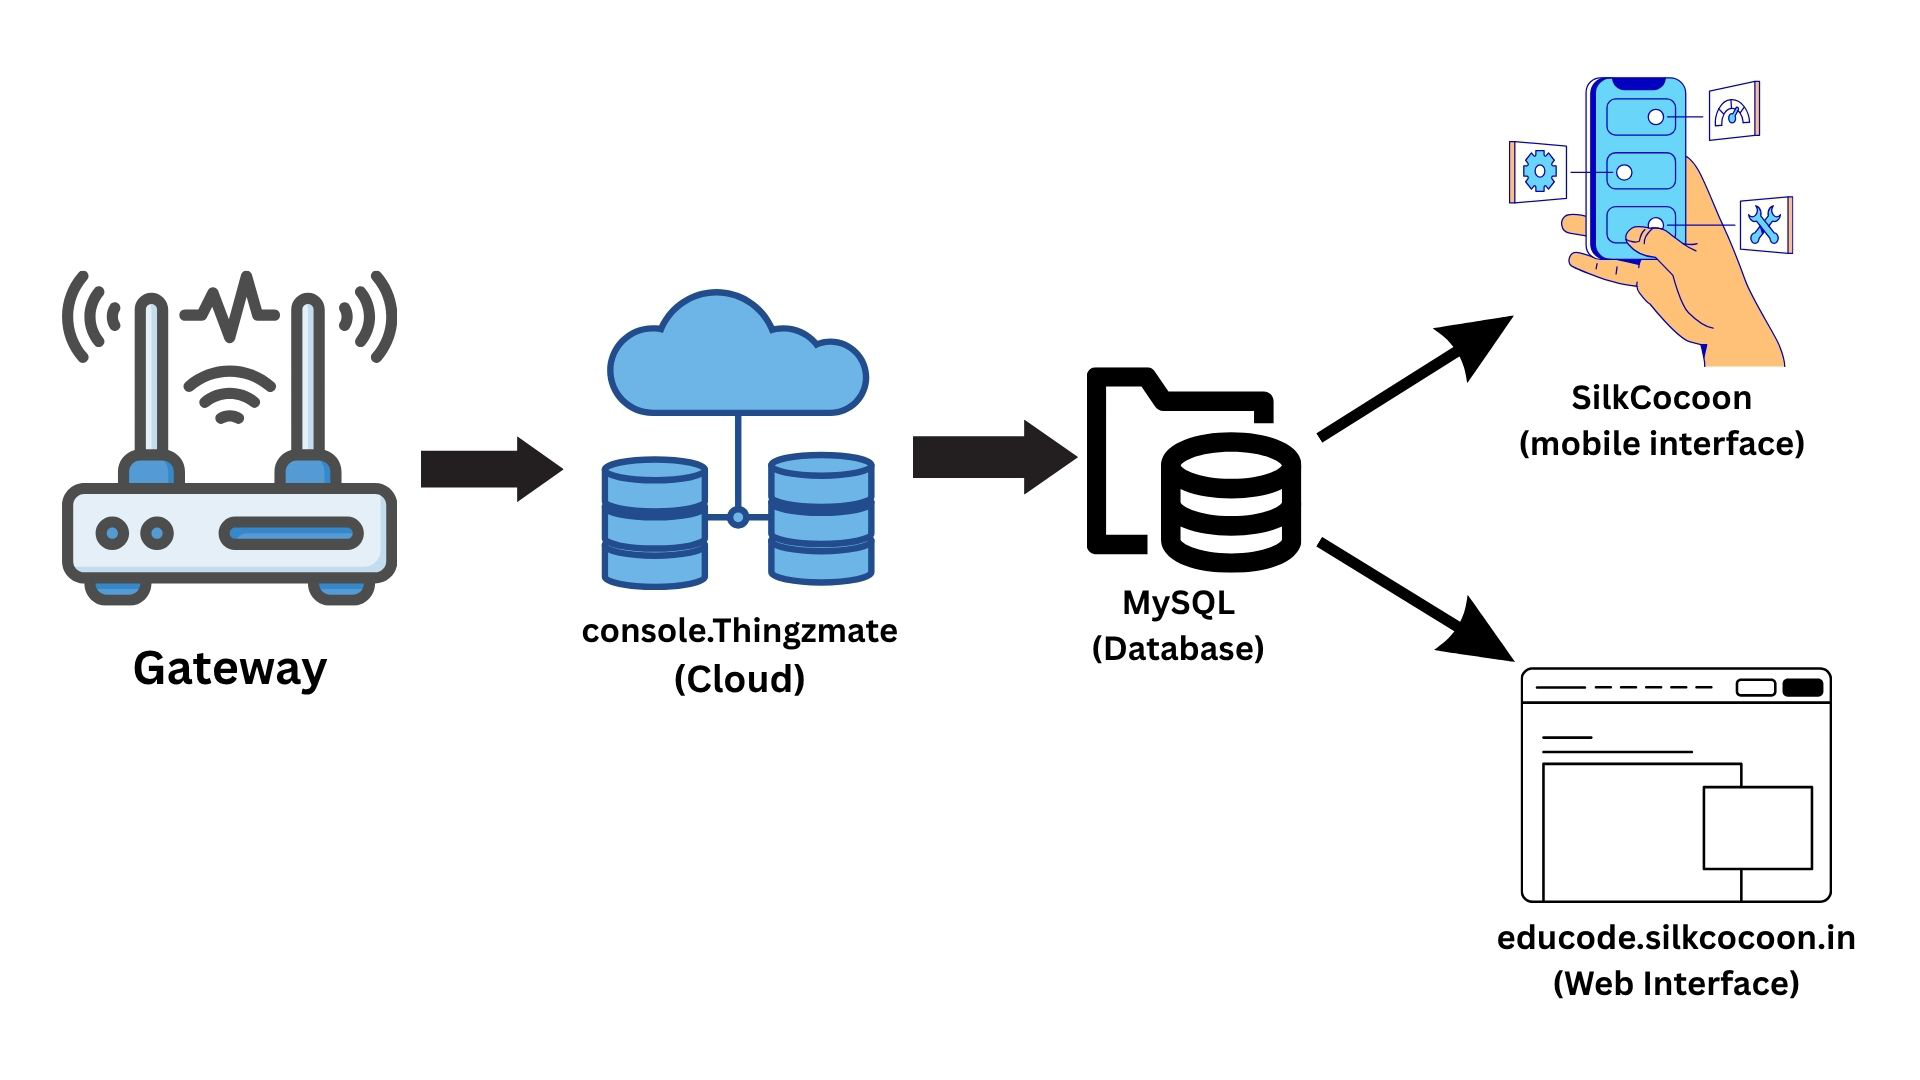
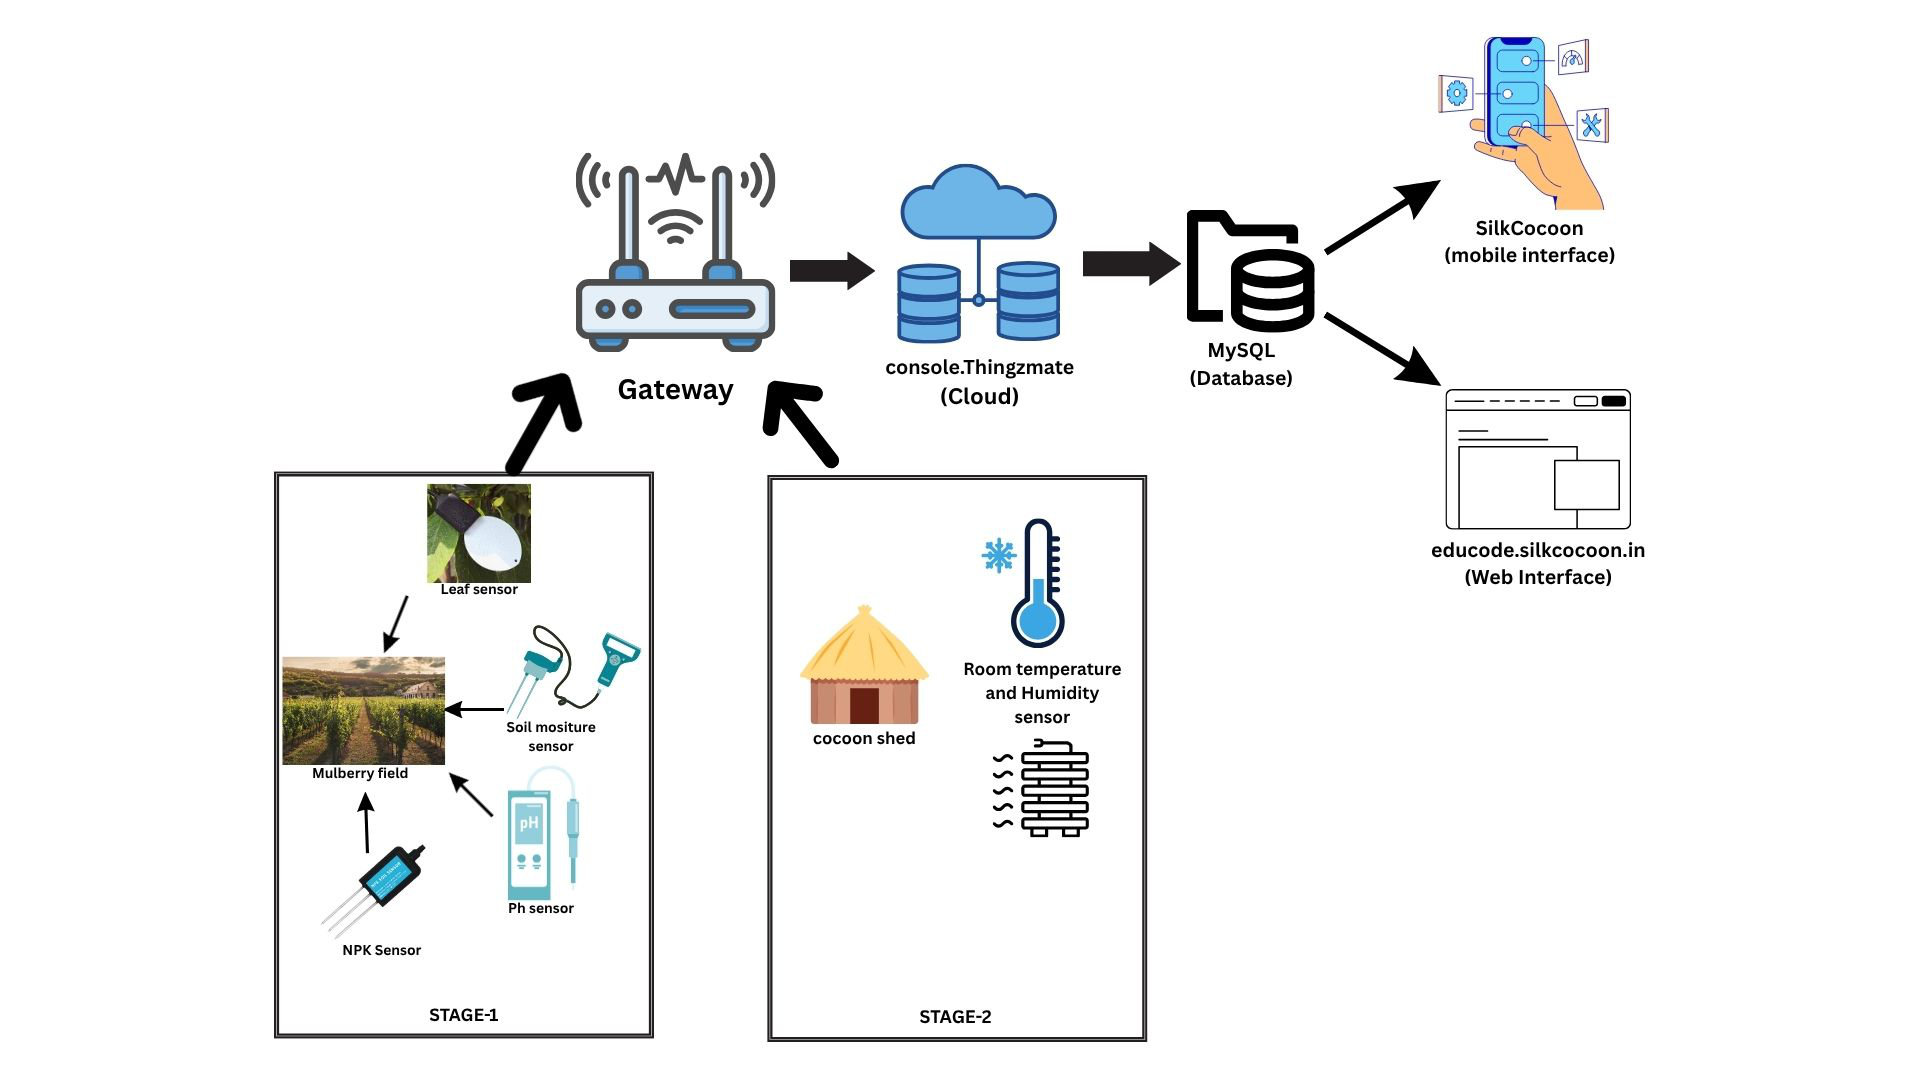
After data is collected from the sensors in both stages, it is transmitted through a LoRaWAN Gateway to the Cloud for storage, processing, and visualization. This section is the digital backbone of the monitoring system — enabling remote access and real-time updates.
The LoRaWAN Gateway acts as a bridge between the field sensors and the cloud. It receives sensor data packets transmitted over long-range wireless communication and forwards them securely to the central cloud server.
The system architecture ensures low-power, long-distance communication, which is ideal for rural agricultural environments with limited connectivity.
The gateway communicates with The Things Network (TTN), which then pushes data to the project’s cloud database through secure MQTT or HTTP webhooks.
The collected data is stored in a MySQL database, where each entry is timestamped and recorded.
The backend is designed to handle real-time updates — if any sensor stops transmitting temporarily, the application displays the latest available readings from the database, ensuring continuous system functionality without interruption.
A PHP-based backend script manages database insertion and data validation, maintaining accuracy and consistency.
The cloud-stored data is visualized through both web and mobile interfaces, providing flexibility and accessibility to farmers, researchers, and administrators.
The web dashboard (accessible via silk.educode.co.in) displays live sensor readings, graphical trends, and historical data analysis. Users can monitor multiple sensors simultaneously, observe patterns, and make data-driven agricultural decisions.
The mobile version offers a compact, real-time view of environmental conditions for users in the field. The interface focuses on clarity and simplicity, showing temperature, moisture, humidity, and pH readings updated directly from the cloud.
This integration ensures seamless communication from sensors to users, combining IoT, cloud computing, and web technologies into a single, unified system. The platform empowers farmers with accurate environmental insights — promoting smart, data-driven, and sustainable silk cocoon farming.